Additional Meaningful Use 2011 Report Analysis
Yesterday, I gave a quick analysis to the newly released Meaningful Use November 2011 Attestation Report. Below you will find some additional analysis focused on ambulatory attestations (Attestors are of “EP” Provider Type). However, please note that all statistical analysis is limited by the available data. What the CMS report does not have is the total number of EPs that are qualified to attest, but have not attested.
Comparing Against Market Share
The above chart compares the 2011 Meaningful Use Attestations for each vendor (limited to the ambulatory setting) correlated against the vendors 2011 estimated market share. What does it mean? In a perfect world, the percentage of the Ambulatory EHR Market Share that a vendor occupied should be positively correlated with the number of Eligible Providers attesting for Meaningful Use in 2011. In other words, the more market share a vendor has, the higher count of attestations they should have as well and the vendors would all fall along the line going through the chart above (r = 1 in statistical terms). The data shows that there is a correlation (r) of 0.688. This means there is some evidence, even though it isn’t overly strong that we can state that the number of attestations might be related to market share. The above chart shows us if a vendor is under-performing or out-performing this assumption. Therefore, Epic, in addition to having a sizable market share, is also out-performing everyone else when it comes to their % of EHR users whom have attested. Allscripts, on the other hand, is under-performing given their market share. A takeaway from this is that AmazingCharts, Sage, e-MDs and Epic may all use the MU returns as a marketing tactic to show what percentage of their customers achieve MU, while the other companies may just focus on their total numbers in their marketing memos.
Who wants to check on the signage at HIMSS 2012 for me and verify this?
Now let’s take a look at this same comparison, but done by EHR product instead of overall vendor.
athenaClinicals, MEDNET, PrimeSuite, and Centricity EMR are all estimated at 1% since they were not identified by AmericanEHR’s report as having more than 2.5%. Here we can see that those, along with e-MDs and Epic all outperform their market share, while the rest under-perform. There is a stronger correlation between the market share of the products and their number of attestations (r = 0.736) than there was for the vendor market share. This shows that customers need to be a little choosey for certain vendors as to which of their products they select. Again, Epic blows everyone else out of the water.
The Long Tail
Total # of Vendors With An Attested Customer: 225
Total # of Vendors With Only 1 Customer Attested: 48
21% of the total ambulatory attestation counts come from vendors only having 1 customer that has successfully attested. What does it mean? This probably shows that the ambulatory EHR market is still a ways from congealing. If some of these smaller vendors can show that a larger percentage of their customers successfully meet Meaningful Use requirements, they may see a good amount of market growth for themselves over the next few years. The question becomes, does this mean there will be more or less consolidation of the EHR market over the next few years than what has been predicted?
Which Products For Which Specialties?
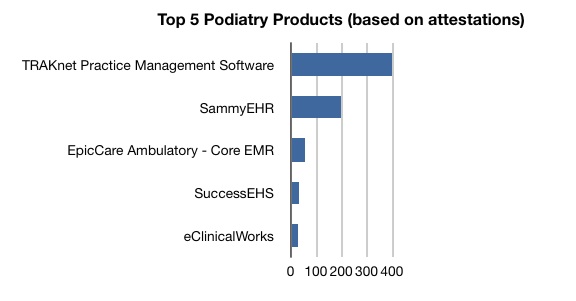
I listed in my previous post the top specialties that had attested (in descending order: Family Practice, Internal Medicine, Cardiology, Podiatry, OB/GYN). Here are what products they were using.
Procrastinate Much?
Perhaps as no surprise to anyone, people took their time in 2011 to attest.


